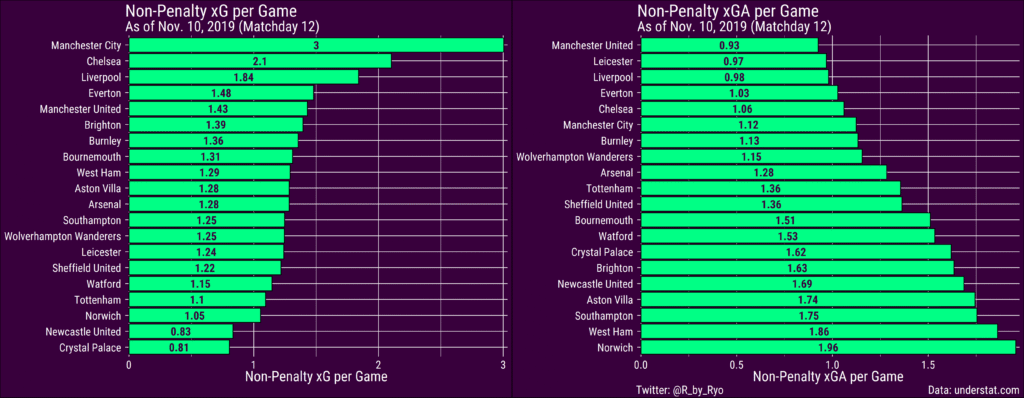
Evaluating underlying shot quality metrics transforms how analysts interpret historical football campaigns, moving beyond surface-level scorelines into the mechanics of chance creation. The 2010/2011 Premier League season was defined by close mid-table margins and erratic away performances, making traditional goal counts a noisy indicator of future performance. Expected Goals ($xG$) quantifies the quality of a scoring chance based on shot distance, angle, and phase of play, while Expected Goals Against ($xGA$) measures defensive vulnerability by evaluating the quality of chances conceded. Applying these two core statistical frameworks to historical match data exposes statistical regression, unearths hidden defensive solidity, and provides a rigorous, objective foundation for match modeling.
Why Traditional Shot Totals Fail to Reveal True Match Dominance
Standard shot volume frequently creates a false impression of offensive dominance because it treats low-probability long-range attempts identical to high-percentage close-range tap-ins. A club taking fifteen shots from outside the eighteen-yard box might generate a combined $xG$ of only $0.45$, whereas an opponent creating two clean open-play cutbacks inside the six-yard box can easily accumulate an $xG$ of $1.20$. Relying on raw shot counts leads analysts to conclude that the first team controlled the game, when in reality their attacking output consisted of low-efficiency attempts easily managed by defensive blocks.
Quantifying Tactical Efficiency Through Shot Quality Distribution
Evaluating team performance requires measuring how effectively a system translates possession into high-value central chances while suppressing the opponent’s access to the penalty box. Analyzing shot distributions across distinct zones during the 2010/2011 season highlights the stark contrast between superficial possession and true structural efficiency.
| Chance Location / Shot Type | Average Conversion Rate | Implied xG Value per Shot | Defensive Impact on xGA |
| Central Penalty Box (Open Play) | 18.5% | 0.18 – 0.35 | High threat; requires immediate central block density |
| Outside Penalty Box (Central) | 3.2% | 0.03 – 0.06 | Low threat; allows defensive lines to maintain compact shape |
| Fast Break / Counter-Attack | 24.1% | 0.25 – 0.50 | Critical threat; destabilizes defensive recovery organization |
The relationship between shot location and conversion rates proves that defensive structures prioritizing central box protection successfully minimize total $xGA$ even when surrendering high shot volumes. Mid-table teams that forced opponents into wide, contested long-range attempts maintained resilient $xGA$ profiles despite appearing under pressure in conventional statistical summaries. Recognizing this structural distinction enables evaluators to identify teams whose defensive resilience is grounded in spatial control rather than temporary luck.
Identifying Regression Candidates via Goal vs. $xG$ Divergence
When a team’s actual goal tally drastically outpaces their accumulated $xG$ over an extended block of matches, statistical regression becomes inevitable. Unusually high finishing conversion rates driven by individual long-range goals or opposition Goalkeeping errors are mathematically unsustainable across a full 38-match calendar.
Observing how data-driven models flag teams overperforming their expected metrics provides vital context when comparing live odds across a dedicated betting destination. Professional handicappers regularly track these underlying variances to pinpoint matches where market consensus overrates an inefficient team coming off a winning streak. Comparing published market lines on a specialized betting destination such as ufabet168 against $xG$-adjusted power ratings allows data-focused analysts to isolate fixtures where public perception remains blind to impending performance regression.
Evaluating Defensive Stability Through Expected Goals Against ($xGA$)
Analyzing $xGA$ metrics provides an unvarnished look at a team’s defensive health by removing goalkeeper performance from the structural evaluation equation. A elite goalkeeper can temporarily hide a broken defensive line by making spectacular saves, resulting in low actual goals conceded despite a dangerously high $xGA$.
- Systemic Vulnerability: A high $xGA$ indicates that midfielders are failing to screen central passing corridors, allowing penetrative passes into dangerous zones.
- Goalkeeper Overperformance: A wide negative gap between actual goals conceded and $xGA$ signals that a team’s clean sheets depend on temporary shot-stopping form rather than sound defensive organization.
- Set-Piece Fragility: Isolating dead-ball $xGA$ highlights specific marking and spatial coverage flaws during corners and indirect free kicks.
Systematically tracking $xGA$ separates true defensive structure from short-term goalkeeping heroics. When a team routinely surrenders high-value chances, their clean sheet record eventually collapses as soon as their goalkeeper’s save rate reverts to historical norms. Grounding defensive analysis in $xGA$ ensures that match evaluations reflect structural susceptibility rather than fortunate outcome sequences.
Analyzing Match-Level Variance and Outlier Scores
High-scoring matches often skew seasonal averages, making single-match $xG$ and $xGA$ differential analysis essential for identifying true baseline capability. A single 6–0 anomaly can unnaturally inflate a club’s offensive metrics for weeks, creating a misleading picture of their average weekly generation.
Conditional Scenario: High Goal Outlier vs. Underlying $xG$ Reality
If a team scores four goals from an aggregate match $xG$ of just $0.70$ due to consecutive defensive errors and unrepeatable long-range strikes, their actual performance level was severely inflated by variance. Under these specific match conditions, treating the four-goal output as evidence of offensive firepower causes evaluators to overestimate the team’s chance-generation capacity in their subsequent fixture against a disciplined, low-block opponent.
Integrating $xG$ and $xGA$ into Value-Based Pre-Match Assessment
Combining offensive expected metrics ($xG$) with defensive expected metrics ($xGA$) creates a net expected goal differential ($xGD$) that serves as the ultimate benchmark for team strength. Teams with a consistently positive $xGD$ control the flow of matches over time, generating higher-quality opportunities than they yield.
Analyzing the fixed mathematical principles behind expected metrics shares a logical foundation with evaluating probability structures across non-sports gaming environments. Systems operating within an established casino online framework rely on fixed mathematical house margins that govern outcomes regardless of short-term player luck. Applying that same cold, mathematical discipline to football analysis ensures that evaluators prioritize long-term $xGD$ differentials over emotional reactions to recent unrepeatable match scores.
Summary
Analyzing the 2010/2011 Premier League season through $xG$ and $xGA$ metrics proves that underlying shot quality provides a far more accurate reflection of team capability than raw goals or total shots. Isolating chance locations, measuring goal-to-$xG$ divergence, and evaluating $xGA$ defensive stability exposes teams bound for statistical regression. By replacing scoreline bias with granular expected metrics, analysts establish a logical, data-driven methodology for evaluating match probabilities and identifying structural performance trends across any football campaign.